

Are your dental treatments and claims making enough profits to keep your practice running?
You can measure that by tracking financial metrics and reports. So, you can get an idea about what you’re earning by treating dental patients.
It also lets you know where you’re losing money, so you can plan on correcting these errors to improve your financial performance.
Want to know how you can track these metrics and use them to improve your practice? Let’s discuss ways to track this data and improve it with strategies like professional dental billing services.
How Can Your Practice Benefit By Tracking Financial Metrics and Reports?
Before we deep dive into tracking metrics and reports, let’s discuss its financial impact on a practice.
Identify and Fix Revenue Losses
Tracking financial metrics helps identify the areas where your practice is losing money. Once you know the weak areas, you can work on improving them, so you don’t experience further revenue loss.
Example: If your claims are repeatedly being denied due to billing errors like wrong CDT codes, missing documents, or incorrect details, you can prevent them from recurring in future claim submissions, and submit clean claims.
Another example is underpayments, where insurers pay you less than the contracted fees. By reconciling claim reimbursements with the contracted fees, you can submit appeals to insurers for correcting claims.
Make Smarter Financial Decisions
Data in financial reports helps you make smarter decisions related to your day-to-day practice operations.
Example: If your practice is growing, you need to invest in multiple areas of your practice, such as:
- Hiring more dental providers or hygienists to meet patients’ treatment needs
- Buying more equipment
- Expanding office hours
If you don’t have available financial data, you just make guesses. But, when you have available reports, you calculate return on investment (ROI) against these expenses and make data-driven decisions.
Set Realistic Practice Goals
With available financial metrics and reports, you get an idea where your practice’s finances stand at the moment, and how far you can improve them. It helps you set future goals for improving certain areas in your financial management. You may also set goals to scale your overall practice.
Example: By measuring your metrics, you can set a goal of increasing production on each patient’s visit by 12% over the next quarter. Or you may set a goal of reducing your accounts receivable by 30-40% in the next two to three months.
And once you’ve set clear goals, thanks to the data, you can start implementing strategies to achieve these targets.
Set a Budget
When you know what you’re earning, where you’re losing revenue, or where unnecessary expenses have drained your revenue, you can prepare a complete budget to manage your practice’s finances.
First, analyze your costs, earnings, and profits. See, if your practice is generating enough revenue to cover expenses and making profits on each dental service.
Check which treatments are profitable, and which costs must be cut down to run practice operations smoothly. And then act accordingly. Prioritize seeing more patients for the certain procedure and reduce unnecessary costs to prevent overspending.
Based on that, set a fixed amount for your practice expenses and provide instructions for your staff to control costs within the benchmark.
Which Metrics Should You Monitor?
The following are the key metrics you should monitor in your dental practice.
Production vs. Collection
What is Production?
Production is the dollar value of a dental service, which you’ve set in your fee schedule according to the treatment cost and profit you expect to earn from it.
Example: You may set $1200 as the fee for a dental crown treatment. The $1200 amount is your production for that procedure.
Gross Production and Net Production
There are two types of production: net production and gross production.
Gross production is the full fee for the treatment which you charge without adjusting the amount. And net production is the fee which you charge after adjusting some amount.
An instance is that when you enroll with an insurance company, you adjust some portion of the total fee, and charge insurers a lesser amount.
Now, if we take the above example of a crown treatment, you adjust $400 from the total amount, and $800 is set as the contracted fee. So, $800 is your net production, which you actually charge after adjusting the original amount.
What is Collection?
While production is what you charge for a dental procedure, collection is the amount you actually receive.
So, measuring collection directly impacts your practice revenue.
Just like production, there are two types of collection: gross collection and net collection.
First, gross collection is the amount which your practice receives from insurance claims or patient bills. It’s the initial amount which you receive before adjusting for refunds, chargebacks, reversed payments, or other adjustments.
Net Collection Rate
Net collection is the remaining amount which you can actually use after adjusting the received amount for refunds, overpayments, or reversals.
It’s an important metric in dental billing as it gives an idea if your practice is getting fair compensation for services rendered.
To calculate net collection rate, divide the total payments you’ve received by your total procedure charges minus contractual adjustments, and then multiply it by 100. The formula gives a percentage, which helps you measure your net collection rate. View this formula below:

Most practices in the industry aim for a net collection rate in the 95-99% benchmark. Now, let’s understand how a collection falls in this benchmark.
Example: You bill $10,000 for a dental procedure. Your insurance contract requires you to write-off $3,000, which means you can collect $7,000. Payer reimburses $6,800, so when you calculate your collection against your fees and contractual adjustments, the net collection rate is 97.14%, which means that your practice has nearly collected your entire amount according to the contracted fee. This collection falls in the benchmark of a good net collection rate.
Production vs. Collection Lag
It’s important to measure the time difference between production and collection, so you can manage cash flow for that timespan. For example, if you’ve collected revenue after 21-30 days of performing the procedure, it’s a long difference. But, if you collect revenue within 24-48 hours, it’s a quick recovery.
Insurance Performance Metrics
These following key metrics are used to check if your dental claim submissions are efficient and generating a good revenue.
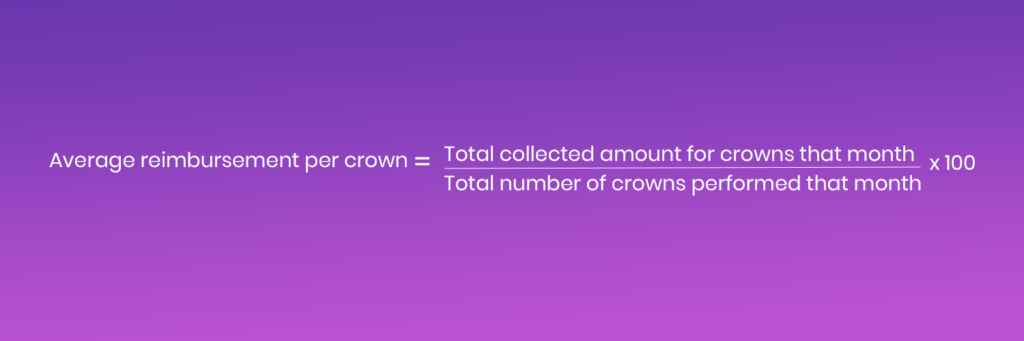
Average Reimbursement per Procedure
This metric helps you check what you’re paid on average for a certain dental procedure within a timespan.
Example: You’ve completed 20 crown procedures during a month and the total amount you’ve collected from insurance claims and patient bills for crowns during that time is $16,000.
To measure the average reimbursement per crown, divide the collected amount ($16,000) by the total number of crowns (20) performed for that month.
Your average reimbursement per crown for that month is $800.
The below formula makes it easier to understand the formula.
Claim Acceptance and Claim Denial
Claim acceptance rate or first-pass approval rate helps check how many claims are accepted in the first submission. And the claim denial rate is a percentage of the number of claims denied.
For claim acceptance rate, the formula is dividing the number of claims paid by the number of claims submitted and multiplying it by 100.
Example: You’ve submitted 500 claims in a month and 491 claims are accepted, your claim acceptance rate is 98.2%. It’s a good first-pass acceptance rate, above the industry benchmark of 90-95%+ first-pass acceptance rate.

Now, apply the same formula for claim denials to check the claim denial rate for that month. Using the same example, 9 claims are denied by an insurer from 500 claims, your claim denial rate is 1.8%, which is a very acceptable metric. It’s a good rate under the industry benchmark of 5-10% denial rate.

Based on that, the aim should be to achieve a higher claim acceptance rate and a lower claim denial rate, which is possible if you partner with dental billing experts.
Denial Rate by Payer
This metric is used to measure the number of times a payer denies your submitted claims.
Just like you measure a denial rate, it’s calculated by dividing denied claims for that payer by total claims submitted to that payer, and then you multiply it by 100.
Example: You’ve submitted 200 claims to Delta Dental and 120 claims to Aetna. Delta Dental denies 10 claims and Aetna denies 18 claims.
When you apply this formula to calculate claim denial rate for both payers, the denial rate is 5% for Delta Dental and 15% for Aetna.

By reviewing denial rate per payer, you can identify denial patterns, review denial reasons, and follow payer policies more strictly to get claims approved.
Reimbursement Variance by CDT Code
Reimbursement variance by CDT code is the difference between expected reimbursement from the insurer and the actual amount you receive for a certain procedure.
It helps you identify the procedures which payers are reimbursing in full or at least at considerable rates, and those which payers are reimbursing at lower rates.
Below is the formula:

Example: You submit a claim for a high-cost crown procedure using the CDT code D2740. Your contracted reimbursement rate for the procedure with the insurer is $1000, which you’re expecting to receive. However, the insurer reimburses $750. The difference is $250.
While $250 difference might look very less on a single procedure, if the insurer continues to underpay you on every procedure, it’s a huge revenue loss!
Just imagine if the insurer reimburses $250 less on 40 procedures, you’re straight away losing $10,000 in insurance underpayments.
To correct this, reconcile payer’s Explanation of Benefits (EOB) statement with your contracted fee schedule once payer reimburses the amount. And if you spot the difference, submit an appeal to correct the underpayment.
And if the pattern continues, it’s time to negotiate your contract terms and make the dental billing and coding process profitable for your practice.
Accounts Receivable Aging
Accounts receivable (A/R) refers to your due amount which is stuck in outstanding insurance claims and patient bills. A/R aging is an important key metric in your practice’s overall revenue cycle, whether you’re dealing with claims or bills.
A/R aging is divided into the following:
- 0 – 30 days
- 30 – 60 days
- 60 – 90 days
- 90+ days
A/R below 30 days is easy to recover as it’s a fresh balance. As pending balances in A/R start to grow older, these become high-risk.
The aim should be to maintain at least 60-70% of A/R below 30 days, which is possible with expert dental A/R management. And you can do that by monitoring your claims or patient balances regularly. When you’re monitoring them daily, you can follow up as your claims or patient bills start to age.
By pursuing insurers or patients intensely but with a professional and respectful approach, you’re likely to recover most of your pending amount.
Patient Metrics
These metrics are used to see if patient communications are faring well and if your practice is generating good revenue per patient.
Case Acceptance Rate
Case acceptance rate is a percentage used to calculate the number of recommended treatments which patients accept in your practice. Or, for simple understanding, it’s used to measure how much of what you diagnose is scheduled or completed.
There are two ways to calculate a case acceptance rate.
The first one is where you calculate it by dollar value. In this formula, you divide accepted treatment value by presented treatment value and multiply it by 100.

Example: The total amount of treatments which you’ve recommended to patients during a month is $40,000. The amount of treatments which are scheduled or completed is $28,000. So, the case acceptance rate is 70%, which is good per industry standards.
In the second way, you calculate the number of recommended treatment plans by the number of accepted plans by patients and multiply it by 100.

Example: You’ve recommended a total of 20 treatment plans to patients during a month, out of which, 14 have been accepted. So, you divide the accepted plans (14) by recommended plans (20) and multiply it by 100 to calculate case acceptance rate, which is 70% in this case.
New Patient Value
This metric calculates how much revenue is generated by a new patient over a set time period.
Example: A new dental patient has received multiple treatments from your practice during a year. They receive preventive services (exams, X-rays, and cleanings) worth $350 and then get treated for fillings and crowns worth $1650.
Based on that, you calculate new patient value by adding the total amount you’ve received from that patient, which equals $2000. It indicates that the new patient has generated a good revenue for your practice.
With this metric, you can focus on strategies to retain these patients by following up with them. This can be done by inquiring about their condition after treatment and reaching out to them via marketing campaigns such as sending new discount offers and deals at their email addresses.
It also helps you to measure if your marketing campaigns are generating good return on investment.
Revenue per Patient
Divide total revenue which your practice has generated by the number of patients you’ve treated.

Example: You’ve treated 500 patients during a week and you’ve generated a revenue of $200,000 during that time. The revenue per patient is $400.
Patient Portion Collection Rate
This metric calculates how much amount you’ve collected from remaining balances of insured patients after the payer has paid its share.
It’s an important metric to measure the effectiveness of your patient billing and collection strategies.
The patient responsibilities which you collect from insured patients include copays, deductibles, coinsurance, and non-covered services.
This percentage is calculated by dividing the collected patient payments by billed patient payments and multiplying these by 100.

Example: The total amount of patient responsibilities after payers have paid their share is $20,000 from multiple claims for a month. You’ve collected a total of $17,000 from these payments. So, now when you calculate the percentage by applying the above formula, the patient portion collection rate is 85%, which is acceptable but needs improvement.
You can improve that with real-time insurance eligibility verification before performing a procedure. It helps you check a patient’s coverage plan and the patient’s responsibilities on time, so you can charge patients at the time of service and prevent revenue leakage.
Practice Metrics
Net Profit Rate
Net profit rate collects how much profits your practice is generating, after adjusting for all the expenses including lab supplies, staff salaries, and other costs.
To calculate this formula, subtract total practice expenses from total revenue to get a net profit.
Total Revenue – Total Expenses = Net Profit
And then divide your net profit by the total revenue and multiply it by 100 to get a net profit rate.
If your practice has a higher net profit rate, it means that your practice is generating good revenue with healthy financial management.

Example: If your practice generates a revenue of $150,000 with a net profit of $45,000, the net profit rate is 30%.
Overhead Percentage
Divide all of your practice’s expenses such as utility bills, staff salaries, supply costs, and rental charges, by your total revenue and multiply it by 100.

It helps calculate if your practice has a low overhead or high overhead. You must aim for a low overhead to control costs and maximize profits.
Example: If your overhead expenses are $50,000 against a monthly revenue of $150,000, your overhead percentage is 33%.
Which are the Core Financial Reports to Track?
The table below explains core financial reports which you need to track your dental practice’s revenue performance.
| Report | Purpose | Financial Impact |
|---|---|---|
| Income Statement (Profit and Loss) | Checking revenue, expenses, and net profit generated over a timespan. | Helps identify if your practice is generating profits or experiencing revenue loss. |
| Accounts Receivable Aging | Categorize all unpaid insurance claims and patient bills by age. | Helps track delays in collections and identify risks in cash flow. |
| Productions and Collections Report | Compare completed dental procedures to actual payments received. | Measures if your billing process is efficient and the practice is generating considerable revenue. |
| Patient Visit and Case Acceptance Report | Track the volume of patients visiting the practice and the number of recommended procedures patients accept. | Highlights how effectively the clinical team communicates with patients and measures potential revenue from appointments. |
| Cash Flow Statement | Provides insights into how much you’re earning and spending. | Ensures the practice can cover operational costs and maintain profitability. |
| Insurance and Payer Analysis | Track how much revenue is generated from each payer. | Identifies payers that delay payments or reimburse lower amounts than contracted rates. |
| Financial Dashboard | Features all KPIs, key metrics, and financial reports in a visual interface. | Provides a visual analysis of the practice’s overall financial performance. |
How to Track Metrics and Generate Reports?
Let’s understand step-by-step how to set criteria and track metrics and generate reports, and act accordingly.
Determine Key Metrics for Your Practice Goals
As we’ve discussed some of the top key metrics to analyze and improve a practice’s financial performance, not every metric is important for your practice.
You must check which financial metrics are important to maximize collections and profitability for revenue growth.
So, set your practice goals and determine what you want to achieve with financial metrics and reports.
Set Key Performance Indicators
Once you identify your financial goals, the next step is to set key performance indicators (KPIs). With KPIs, you can measure your financial performance and see if your practice is successfully meeting its goals.
You can set some metrics as KPIs for a set amount of time. For example, you may aim to achieve:
- 70% case acceptance rate by the end of the month
- 90% or higher patient portion collection rate during the first quarter
- 95% or higher net collection rate for the past 30 days
- 5% or lesser denial rate for insurance claims every month
Once your staff knows what to achieve, they can work on it and implement strategies to improve processes.
Use Software to Automate Data Generation

Once you’ve set your financial goals and KPIs, automate your financial data tracking. Mostly, practice management software (PMS) features metrics and reports on practice-related aspects such as production versus collection and accounts receivable. Overall, a PMS guides about expected money you should earn.
And dental billing software, which deals with insurance claims, provides insights on claim acceptance or denial rate, lag between claim submission and reimbursement, and other key metrics. In short, the billing metrics guide about the amount you’ve actually earned.
By integrating PMS with a billing software, you get a unified dashboard, which provides real-time insights on your financial data. You get details like revenue trends, which allow you to track what you’ve earned, and match if earnings are accurate according to your fee schedule.
It also generates financial reports, letting you measure profitability, monitor cash flow, identify revenue leakage, evaluate performance, and track growth over time.
Set Clear Report Frequency and Responsibility
Set a clear schedule for generating and reviewing reports. Reports should be generated:
- Daily for productions and collections
- Weekly for insurance aging and denials
- Monthly for profitability and A/R trends
Assign roles to your staff members, so they monitor these reports on their set time, and don’t miss the areas which need improvement or those which are already profitable and can be leveraged more.
By reviewing data, your staff can detect issues early instead of managing financial issues after they start affecting your practice management.
Compare Net Production to Net Collections
Net production and net collections are the real metrics, which you’ve to measure, because this is what you actually expect to receive (net production) and collect (net collection) after contractual and financial adjustments.
Comparing net production to net collections helps you measure if you’re actually collecting what you expect, and if your practice is efficient in converting procedures into cash.
If net collections are lesser than net production, it means you need to optimize your revenue by:
- Checking denied claims and correcting them
- Taking proactive steps to improve claim acceptance rate
- Speeding your follow up on unpaid patient balances
Example: Your net production is $100,000 for a month, which you actually expect to receive after contractual adjustments. Now you collect $95,000 from claims and patient balances, and have to return $2,000 to the payer due to overpayment. After adjustment, your net collection is $93,000, which means that collections lag behind productions with a gap of $7,000. Find reasons for this gap and correct them fast to recover revenue.
Identify Revenue Gaps
Using the available dashboards and reports, review your financial performance every month, and identify revenue gaps, whether these are:
- An increase in accounts receivable
- A rise in claim denials
- A growing number of write-offs
- A decline in patient payment
Also categorize this data by payer, patient, provider, or procedure, so you get an idea where your revenue leaks, so you can take corrective action.
Example: Your revenue gap in net production versus net collection is $7,000 for the month of January. This is, because, in January, your:
- A/R has increased by $2,000
- Additional claim denials have resulted in revenue loss of $2,000
- Amount of $1,500 is written off in contractual adjustments
- Patient payments of $1,500 haven’t been collected
When you break the data by payer, patient, provider or procedure, you find that:
- Payer: Delta Dental has denied 18% of your insurance claims due to missing documentation
- Patient: Patients, paying for dental procedures without insurance, are taking time to pay their complete amount.
- Provider: A provider has outstanding balances due to multi-phase treatment plans, which are fully accepted but partially paid by patients.
- Procedure: The insurer is reimbursing less on crown procedures.
Review Reports and Optimize Revenue
Once you’ve highlighted the revenue gaps, it’s time to use the data from financial reports, and correct billing errors.
If you verify a patient’s coverage on time, you know all patient responsibilities, so you can charge them on time, which leaves no pending A/R. And then with smart front office management, you can effectively and clearly communicate patient responsibilities on the counter. So, they don’t get surprise bills, and are more likely to plan treatment and pay.
You also need to adjust treatment scheduling and renegotiate your insurance contracts, so you get favorable reimbursement rates.
Regular follow-up is also an important step which you must not miss, as you review your outstanding balances and work to collect most of them. For example, you can catch denials and underpayments on time and send appeals within insurers’ deadlines, so you can expect to receive fair reimbursements soon.
Outsource Financial Management
Tracking financial metrics and reports can take up much of your time, especially if your staff finds it challenging to manage economics.
You can save up your time and relieve your staff of this burden by choosing to work with a professional dental billing company like TransDental, which doesn’t just manage your claim submissions.
Using AI automation with supervision from certified billing and financial experts, the company tracks key financial metrics to monitor your revenue performance, and also assists in identifying and correcting revenue leaks by:
- Maximizing patient collections
- Reducing accounts receivable with:
- Real-time eligibility verification
- Submitting clean and compliant claims
- Following up on pending balances
- Collecting patient balances smoothly
- Generating financial reports
As a result, your collections are smoother, claim denial rate is lower, and revenue gaps are lesser.
And all that happens at costs your practice can easily afford!
Conclusion
Tracking dental financial metrics and reports is important to know what you’re earning and where you’re losing money. Getting the data timely helps correct issues before it becomes difficult to manage them later on. So, automate your practice’s financial management to improve your billing processes and maximize collections with profitability.
Frequently Asked Questions (FAQs)
Where can I find templates for dental financial reports?
You can find templates for dental financial reports through your practice management software, which generates automatic reports.
What are key performance indicators for a successful dental practice?
Major key performance indicators include case acceptance rate, collection ratio, net profit rate, revenue per patient, overhead percentage, and claim acceptance or denial rate. These indicators may vary according to your practice’s requirements.
What are the best software options for tracking dental financial metrics?
The top software options for managing and analyzing dental finances depend on your practice’s requirements. You may use your existing practice management software, or partner with TransDental, which integrates its billing process with your PMS, and provides real-time insights into your financial metrics.
How can I generate dental practice financial reports automatically?
Integrate your practice management software with your dental billing software. Most systems collect procedure, payment, and insurance data in real time and use built-in report templates or dashboards to summarize it. By setting up scheduled reports or real-time dashboards, the software can automatically calculate metrics like production, collections, and AR aging, giving you a unified view of your practice’s financial performance.