

Measuring dental RCM KPIs and performance metrics is important to keep your practice running. It helps you know how your practice’s revenue cycle is performing. You can find the areas for improvement, and start working in that direction.
You may need to improve your eligibility verification and front-end operations, or check the reasons that lead to repeated claim denials.
You should also regularly monitor unpaid balances. The practices, which earn $1 million annually, and ignore this, experience revenue loss of an average $150,000 to $200,000.
So, to prevent that, it’s important that we learn what these KPIs and metrics are and how implementing them makes your practice’s dental revenue cycle management smooth.
What’s the Difference between Dental RCM KPIs and Performance Metrics?
Dental RCM KPIs and performance metrics might sound confusing as the same thing. But that’s not the case. These are set and tracked for the same purpose, and that’s improving revenue performance. But these work differently.
So, let’s understand what’s the difference between these two terms, so it’s easier for your staff to evaluate metrics and make important financial decisions for your practice.
First, we’ll discuss key performance indicators (KPIs). These are metrics which help you check if you’re meeting your set goals within a set timespan. For example, you may aim to send clean claims by 98% within 30 days, or collect $80,000 from outstanding patient balances.
Secondly, we’ll discuss performance metrics. These are the metrics that help track your financial activity or performance. Unlike KPIs, these may not be linked to a certain goal and may not indicate success or failure.
However, it depends on how important they’re in your revenue cycle. Each practice has its own criteria to define success or failure.
Why Do You Need to Measure RCM KPIs and Performance Metrics?
By tracking RCM KPIs and performance metrics, you can easily spot issues in your dental revenue cycle, which may become major revenue losses.
Just suppose your claim denial rate rises from 5% to 12%. You can easily find the reasons, which may be:
- Incomplete or inaccurate eligibility verification
- Missed steps in the claim submission process
- Lack of proper training for the staff
You can quickly start working to fix the issues.
Plus, if you monitor these metrics regularly, your staff knows how good collections, clean claims rate, and consistent cash flow are related and if your practice is underperforming in these metrics, it can affect your profitability.
So, your staff can start planning steps before even submitting claims. This proactive approach saves the valuable time spent in billing and protects your revenue.
With this data, you can also manage other financial aspects of your practice, such as hiring new staff, buying supplies or equipment, or investing in a RCM software for fast processing. The result is that you know what you’re earning and you can decide how to allocate spending to different areas in your practice.
What are the Top RCM KPIs and Performance Metrics?
Let’s have a look at the top metrics most dental practices track.
Clean Claim Rate
Clean claim rate is a formula, which calculates the number of claims which are submitted without any errors, and comply with payer policies.
A higher clean claim rate means that you’re likely to receive faster payments and in case a claim is denied, you need to rework less.
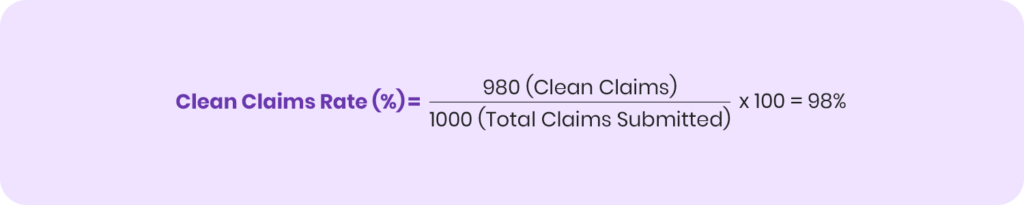
To calculate a clean claim rate, divide the number of clean claims by the total claims you’ve submitted, and then multiply it by 100.

Example: If you’ve submitted 1000 claims, and 980 claims are clean, then your clean claim rate is 98%, which is a very good rate.
Net Collection Rate
Net collection rate is the actual amount you collect from insurance claims and patient bills after adjusting for reasons like refunds, overpayments, reversals, and contractual write-offs.
Calculating this rate helps your staff know what your practice has actually earned and check if earnings are profitable enough to keep your practice running, or your practice is losing money and needs fixes in processes. This calculation makes it the most important metric in your revenue cycle.
A net collection rate is calculated by dividing the total payments you’ve received by total charges of a dental procedure subtracted by contractual adjustments. You then multiply it by 100 and get a percentage, which is your net collection rate.

Example: You’ve performed dental procedures worth $500,000 in a month. $20,000 have been adjusted in insurance write-offs and contractual adjustments. So, your adjusted collectible is $480,000. However, you’ve actually collected $460,000. Now, when you calculate the formula, the net collection rate is 95.8%.

Days in A/R
The days in A/R are an important metric in accounts receivable management. This metric is used to calculate the average number of days required to collect payment.
It helps calculate how faster your practice recovers payments from outstanding balances and where it’s losing money.
If your days in A/R are lower, it means that your practice’s finances are healthy. If these days are higher, it means that revenue is stuck for long and you need to implement strategies to recover revenue.
You can calculate days in A/R by dividing your practice’s total outstanding balance (total A/R) by your average daily charges.

Example: Your total outstanding balance is $300,000 and your practice’s average daily charges are $10,000. So, when you divide the total accounts receivable by these average daily charges, your days in A/R are 30 days. It indicates that your finances are healthy, as most practices aim to keep their accounts receivable between 30 and 45 days or lower.

Denial Rate
Claim denial rate is very important for your practice. It’s a percentage of the claims that are denied by payers. If the denial rate is high, it means your staff has to rework and it delays your payment, making your cash flow slower.
By knowing this metric, your staff finds billing errors or issues at payer’s end. They work to resolve these issues and save time spent in correcting mistakes and appealing to payers for resubmission in future.
To calculate a denial rate, divide the denied claims by the total number of submitted claims and multiply them by 100.

Example: You’ve submitted a total 1000 claims during a month. Payers have denied 350 claims. When you divide 350 claim denials by the total 1000 claim submissions, your denial rate is 35%. It’s a good number, as compared to the huge denial rates practices experience.

A/R Aging
Accounts receivable aging is the process of breaking down outstanding balances into A/R aging buckets, which we’ll explain in the table below, with their risk levels.
| Aging Bucket | Risk Level |
|---|---|
| 0-30 days | Low risk, easy to collect |
| 30-60 days | Moderate risk, require follow-up |
| 61-90 days | High risk, need to prioritize collections |
| 90+ days | Very high risk, may result in write-offs, if not collected sooner |
It helps you know which outstanding balances are fresh and older. Older balances are high risk and require intense follow up and pursuit, otherwise you may have to write off the amount, and accept revenue loss.
Now, to calculate A/R aging, divide the balance in each bucket by total accounts receivable and multiply it by 100.

Example: Your total practice A/R is $100,000.
Your accounts receivable in each aging bucket is the following:
- $60,000 in 0-30 days
- $15,000 in 31-60 days
- $7,000 in 61-90 days
- $18,000 in 90+ days
Divide $60,000 outstanding balance in 0-30 days aging bucket by your total A/R of $100,000, the result is 60%.

It means that 60% of your A/R is low-risk.
However, that’s where most recovery teams get mistaken. Now $60,000 is a fresh balance and is easy to recover. But, if you ignore it and prioritize collecting $18,000, which is older than 90+ days, you might lose the high-value $60,000 amount.
In this case, you’ve to evaluate your outstanding balances and see which balances are easy to recover and which revenue loss is bearable for your practice. If your efforts and resources spent in recovering older balances are higher, you might want to consider writing them off and focus on recovering newer balances.
This is a conflicting situation, where most recovery teams can’t find the right solution. The best way to resolve this is to invest in professional A/R management services. A/R experts evaluate your entire revenue cycle, A/R accounts, and practice requirements. Based on the analysis, they implement the right strategy and help recover your overdue balances.
As a result, you don’t have to worry about recovering payments, while these experts calculate, manage, and optimize accounts receivables for you.
Patient Collection Percentage
It’s an important metric, helping your staff calculate what your practice has collected from patients. The amount you have to collect are non-covered services and patient responsibilities.
Non-covered services are dental procedures, which insurers don’t reimburse at all. Other patient responsibilities include copays, deductibles, and coinsurance after insurance covers its share.
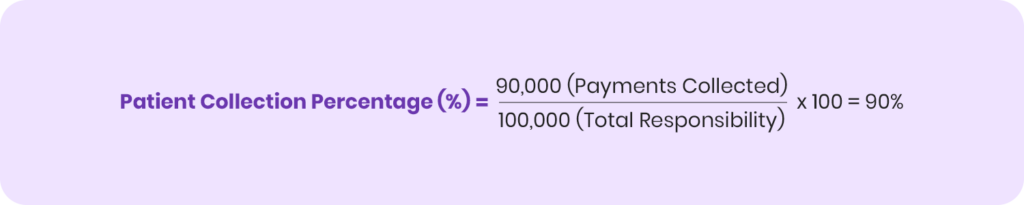
The calculation is simple: divide total collections from payment by total amount patients have to pay, and then multiply it by 100.

Example: You’ve to recover a total of $100,000 from patients. You’ve already collected $90,000. Now divide $90,000 by $100,000 and multiply it by 100. The patient collection percentage is 90%. It’s a good rate from due patient balances.
Point-of-Service Collection Rate
You can effectively improve patient collection percentage if your point-of-service collection rate is good. A good POS collection rate prevents A/R growth and reduces the need to follow up or bill invoices to patients later, as you collect patient balances on time.
This metric calculates the percentage of patient balances you collect at the time of visit.
It’s calculated by dividing the point-of-service collections by the total charges patients have to pay at the visit, and then you’ve to multiply it by 100.

Example: Overdue patient balances at the time of visits are $100. You’ve collected $70 at visit. When you calculate them, your POS collection rate is 70%. It’s a good number as it shows you’ve collected most of your patient balances.

Adjustment Rate
Adjustment rate is the percentage which calculates the total amount you’ve adjusted and the total dollar amount of dental procedures. You divide the total adjusted amount by the total billed charges and multiply it by 100.

It helps monitor the revenue a practice loses to writeoffs and discounts. And, if the rate is high, it means that the revenue loss is huge.
Example: Over the period of two months, you’ve billed $500,000 to insurers and patients for dental services rendered. The total amount adjusted for insurance write-offs, contractual adjustments, and other write-offs is $50,000. Now, when you calculate the adjustment rate, it’s 10%.
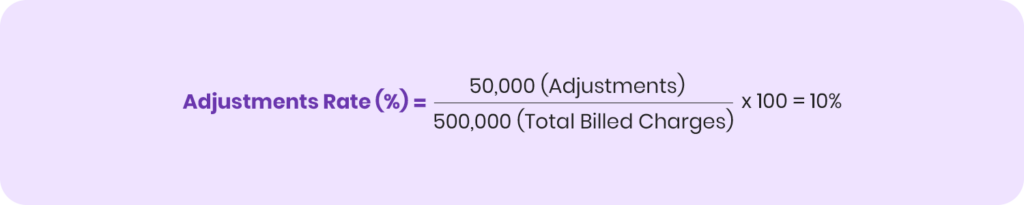
So, that means, 10% of your billed charges are written off. It drives the need to identify weak areas in revenue performance and work to improve them.
Verification Completion Rate
Verification completion rate is an important metric, which highlights efficiency or weaknesses in the insurance eligibility verification process.
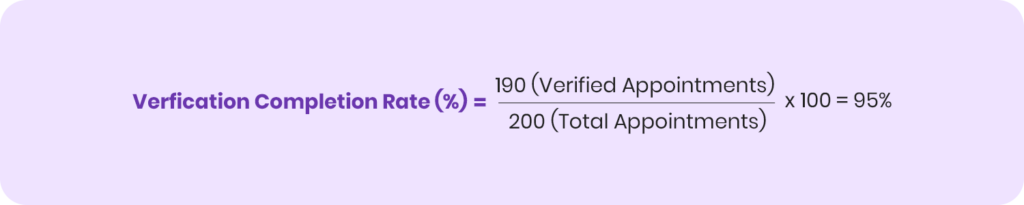
It’s calculated by dividing verified appointments by total scheduled appointments and multiplying it by 100.

It’s important to achieve a good verification completion rate for a healthy revenue cycle. If you verify patient coverage on time, it reduces claim denials, makes payments faster, and boosts your practice’s collections.
Example: Your practice has scheduled 200 dental appointments in ten days. You’ve verified patient eligibility and coverage for 190 appointments. The verification completion rate is 95%.
Pre-Authorization Obtained Rate
Payers require prior authorization for dental procedures, which are high-risk or expensive. These mostly include crowns, dentures, bridges, implants, and oral surgery-related procedures.
It’s an important step in eligibility verification, where you find out which procedures require pre-authorization by the payer. You must send a pre-authorization request letter, in which you justify the necessity of the procedure, and must wait for payer approval. If the payer approves it, you can submit the claim.
If you don’t request pre-authorization for required procedures, the payer denies your claim, which results in payment delays, reworks, and appeals.
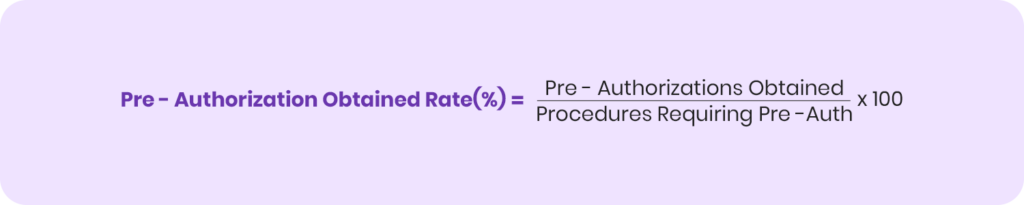
Aim for a good pre-authorization obtained rate. It’s calculated by dividing the pre-authorizations obtained by total procedures requiring pre-authorizations. You then multiply it by 100.
Example: Your practice has performed 50 dental procedures requiring pre-authorization during a month. However, you’ve obtained pre-authorization for 45 procedures. When you calculate them, your pre-authorization obtained rate is 90%.
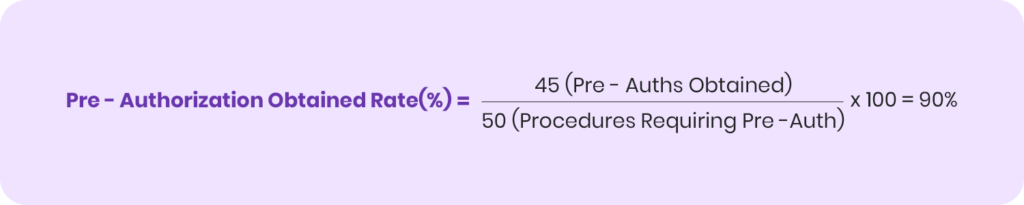
While 90% is a good rate, aim for 100%, so no pre-authorization is missed, and your revenue is secured.
Charge Lag
Charge lag is the time difference between performing a dental procedure and entering its charges into the billing system. This means:
- Entering details of a procedure by filling its form
- Mentioning its CDT code
- Recording its contracted fee in the system
It’s calculated by subtracting the date when you’ve entered the charge by the date when you’ve performed the procedure.

Example: If a patient is treated for a root canal at your practice on February 6, and you enter the charge on February 10, the charge lag is 4 days.
The best practice is to immediately enter charge in the system and process claim submission. If the charge lag is higher, it delays your claim submission and payment. Reducing it improves recoveries, speeds up payments, and prevents A/R aging.

Insurance Aging Analysis
Insurance aging analysis is the process of organizing unpaid dental insurance claims into aging buckets and risk levels.
While it’s related to the A/R aging we discussed earlier, it’s slightly different as it focuses on insurance claims rather than overall outstanding balances.
You need to prioritize collecting balances from unpaid claims older than 90 days or more. These are high-risk, and require consistent follow-up and pursuit, before the insurer denies it and refuses to pay.
The aim is to keep unpaid insurance claims in the 0-30 day bucket, or try to resolve these claims quickly to control A/R aging.
Denial Follow-up Efficiency
Claim denials require follow-up processes, so you can recover your amount fast. The denial follow-up efficiency calculates how fast you manage, appeal, and recover payments against denied claims.
A key metric used to check your follow-up efficiency is appeal success rate or recovery rate. It’s calculated by dividing the number of denied claims successfully overturned and paid by the total number of appeals for denied claims, and then you multiply it by 100.

Example: You’ve appealed for 200 denied claims. Payer has overturned and paid 150 claims. The appeal success rate is 75%, which is good, and you should aim for a higher rate to recover more payments.

Patient Retention Rate
Patient retention rate is a metric, which measures the percentage of patients, who continue to keep visiting your practice for treatments. If your practice has a high patient retention rate, it means that patients are satisfied with your services and revenue streams are consistent.
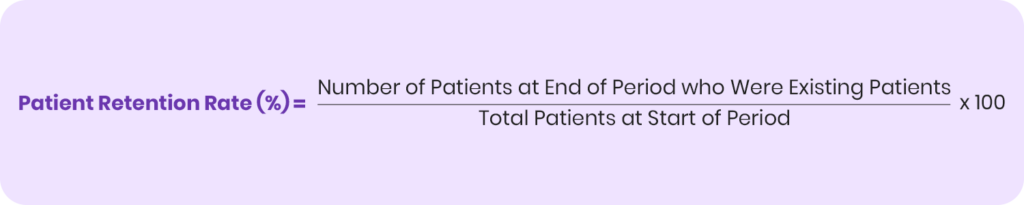
It’s calculated by dividing the number of existing patients at the end of a certain time by the number of total patients at the start of that time. You then calculate it by 100.
Example: Your practice is seeing a total of 500 patients at the start of a year. By the end of the year, 425 patients are your regular patients, who keep returning to your practice for dental check-ups and treatments. When you calculate the percentage, the patient retention rate is 85%, which is a good metric. It means more patients are returning for follow-up care.

No-Show / Cancellation Rate
No-show or cancellation rate is the percentage of scheduled patient appointments cancelled during a certain time.
It’s important to track and reduce this rate. A higher cancellation rate means losing out on patients, and it also makes difficult to forecast revenue performance.
To calculate the cancellation rate, divide the total number of cancelled appointments by the total number of scheduled appointments and multiply it by 100.

Example: You’ve scheduled 400 patient appointments during a month. 40 appointments are cancelled. The cancellation rate is 10%.

It impacts your earning opportunities, as you’ve reserved these slots for the scheduled patients. When they don’t show up, you can’t check other patients, which delays your revenue growth.
How to Improve RCM KPIs and Performance Metrics?
Let’s discuss some ways through which you can improve KPIs and performance metrics.
Verify Insurance Coverage in Real-Time
Real-time eligibility verification helps you check every insured patient’s coverage details like available benefits and frequency limitations on the spot, so you can charge them on the counter for the patient’s responsibilities. With that, there are no payment delays or revenue losses.
You also know what insurance covers, so you submit clean claims, which increases chances of faster payments and reduces claim denials.
Improve Patient Experience and Collections
Implement the best front office management in your practice to deliver an excellent patient experience.
Whether it’s scheduling appointments or sending reminders for patient visits, a strong front-end improves patient retention rate and reduces no-shows or cancelled appointments.
Plus, effective communication with patients is also important here, so, your front end staff explains what patients need to pay. They must do it in an emphatic way to connect with patients and build lasting relationships. The front office team should explain the necessity of the treatment.
Some patients may hesitate to accept the treatment due to affording high rates, so you can either offer them discounts or create flexible payment plans, which allow them to pay total charges via monthly installments. Set the installment price easily affordable for the patients, so it doesn’t affect their monthly expenses.
With this strategic approach, you can boost patient retention rate, maximize collections from patient balances, and drive revenue growth for your practice.
Recover Claims from Aging Insurance Claims
The best approach is to follow a step-by-step process:
- Submit clean claims: Check your claims via claim scrubbing to detect errors and correct them, so your claims are complete. It prevents errors.
- Flag aging claims: Review insurance aging reports at least once a week and flag claims that are closer to 30+ days
- Follow-up with insurer: Check the claim status by contacting the payer for updates. You can do that by calling them or checking in the payer portal. Ask the reason for payment delay and see if there are any billing errors like incorrect CDT codes, missing documents, or inaccurate details.
- Resolve issues fast: Provide required documents, correct errors, use accurate CDT codes, and resubmit claims immediately.
- Escalate to claims supervisor: If you’re still experiencing payment delay, escalate the issue to a claims supervisor or provider relations representative provided by payer.
- Document all follow-up attempts: Prepare a complete record of all the follow-up attempts including call dates, reference numbers, representatives whom you’ve contacted, and details of your conversations.
- Leverage Prompt Payment Laws: If the payer hasn’t paid within the legal payment timelines, reference your state’s Prompt Pay Laws, which require insurers to pay within the deadline. If they don’t reimburse, they have to pay additional charges.
- Explore legal options: The last resort is to file a complaint with the state insurance department or use other legal options to recover payments.
Automate Revenue Tracking
Use RCM automation and software to optimize your revenue cycle and track its metrics. By using a practice management software or a complete RCM software, you can review your financial performance in real-time via a dashboard.
The dashboard helps you see all the key metrics like collections, claim submissions, denials, and aging reports all in one place. It helps you monitor key performance indicators like net collection rate, days in A/R, and claim denial rate, so you can check how close you’re to achieving your goals.
You can also:
- Find the payers which deny rates at a high volume. Explanation of Benefits (EOB) statements help you find the denial reasons and prepare a strategy to correct them via follow-ups and appeals.
- See the number of write-offs with available reasons to assist you with strategic planning.
- Check aging claims or unpaid patient balances, so you can implement an A/R management stratectagy to recover payments.
Along with the metrics, you can also check ongoing revenue trends and receive forecasts for future performance, based on historical patterns. An advanced system provides suggestions for improvement.
All the available data makes it easier for your staff to evaluate the performance and see how they can improve their processes.
Compare Payments to Fee Schedules
Practices often experience receiving lesser payments than the contracted fee with the payer, which leads to revenue loss. So, when payers reimburse your claims, check the EOBs and compare payments with the contracted fee schedules.
Check payer policies and reimbursement rules to check their requirements on reimbursing claims. See if your claim completely complies with the rules. If it does, submit immediate appeal requests to the insurer to correct the payments. Reference your contracted fee with the insurer for the CDT code and request them to pay you the actual amount for the procedure.
Strong and professional appeals mostly win payments.
Outsource Dental RCM
Managing your entire dental revenue cycle isn’t an easy task. There are many aspects involved from scheduling a patient’s appointment to checking received payments and following up on them.
It is costly and also takes up much of your staff time. You can reduce overhead and save time to boost your staff productivity by partnering with a dental RCM company like TransDental, which manages all the revenue cycle tasks for you.
By using advanced technology like robotic process automation, it performs all the revenue cycle tasks much faster and results are almost accurate. It not just helps your practice track RCM trends but also see improvement in performance with proven results.
And the best thing is that these services are available at a very affordable cost, which is much less than the salaries you’re paying to staff members for managing your revenue cycle. You also get a dedicated account manager to provide you support with all the processes and queries.
And you get reports on revenue performance, which builds confidence and trust.
Conclusion
Dental RCM KPIs and performance metrics are important to track and measure your revenue performance, so you know how much you’re earning from dental services rendered. These metrics help you identify weak areas, which you can improve by automating RCM to track metrics in real-time and optimize revenue cycle processes. You may also choose to outsource the revenue cycle, so your RCM partners do the job for you, while you focus on improving patient care. Restored smiles mean more dollars and a happy practice!
Frequently Asked Questions (FAQs)
What are top dental RCM KPIs to improve practice revenue?
The top dental RCM KPIs to improve practice revenue include A/R days, clean claim rate, denial rate, collections ratio, and patient payments. These are monitored to spot revenue leaks and speed up cash flow.
What are the essential KPIs for dental revenue cycle management?
Essential KPIs for dental RCM include A/R aging, claim denial rate, net collection rate, and claim approval rate to keep RCM healthy.
How to measure dental RCM efficiency using key performance metrics?
Measure claim turnaround, denials/rework, point-of-service payments, and staff productivity to check the speed and accuracy of your revenue cycle.